
[2000 Words; 20 Minute Read] There are forms of market failure due to external costs and benefits that need to be calculated and internalized to ensure that all economic resources are considered. Externalities, such as the costs of pollution as an obvious and relevant example, will need to be measured and valued if it is to be accounted for as a full economic cost. Environmental pollution will be detrimental to another (3rd) party’s resource inputs and therefore has significance to the scarce allocation of resources to meet infinite wants in society. Here I explore a Cost-Benefit Analysis (CBA) approach to measuring and valuing economic costs and benefits that will apply to the social and environmental development of urban spaces. Cost-Benefit Analysis (CBA) will be demonstrated whilst incorporating an element of discounting of money, to account for changes in monetary value over time. Measuring and valuing environmental and social phenomena that are produced, consumed and/or used in urban areas is problematic but wholly necessary if their costs (and benefits) are to be met by society in its entirety. Hence, an overview of the issues, relevance and pragmatics of valuing the environment is shown.
- Cost Benefit Analysis and Discounting
Due to the critique of tax incentives being unable to fully internalise any externalities or address market failure, other techniques to value beyond the internal market are appropriate for environmental resources that are produced and used in urban areas. A well-used technique in practice that can capture social and environmental goods and services is through cost-benefit analysis (CBA). What is particularly useful in the CBA approach is that the net cost or benefit of a project can be calculated over different time periods, plus the changing value of money over this time period can be incorporated into the overall cost and benefit of a project. The application of a project is often given to CBA approaches, as it is often the larger scale project scale that uncovers and brings into focus the wider social and environmental impacts that may occur.
- What is Cost-Benefit Analysis?
Cost-Benefit Analysis (CBA) makes operational, the very simple, and rational, idea that decisions should be based on some weighing up of the advantages and disadvantages of an action. CBA is seen as a useful way to apply monetary values when comparing like with like of both costs and benefits. As previously stated, what CBA does allow is for analysis to go beyond the idea of an individual’s balancing of costs and benefits to society’s balancing of costs and benefits – in effect the measuring of external costs and benefits as well an organisations internal costs and benefits. In returning to the principles of economic and the definition of term, costs and benefits are defined according to the satisfaction of wants, or preferences. If something meets a want, then it is a benefit. If it detracts from a want then it is a cost. More broadly to combine social and environmental costs, anything is of benefit if it increases human wellbeing, and anything is a cost if it reduces human wellbeing. In order to set some parameters of what CBA can achieve, it should be noted that CBA is not the technique to assist in decisions on measuring and valuing environment and social benefits and costs (or in combination, well-being), particularly as other approaches as described may be more appropriate. Furthermore, in using CBA as a technique, there will be a need for more considered judgement in deciding when to use CBA and when an alternative approach (e.g. market analysis) will be more effective and accurate.
- Measuring and Valuing Environmental Costs
In walking-though a typical CBA, it is now demonstrated what environmental economic costs and benefits of pollution control can be quantified and valued. Pollution control is the specific ‘project’ in mind when extracting the full costs and benefit that need to be considered as of significant importance. In drawing out environmental costs and benefits of pollution control in this example, the social costs and benefits of the environmental pollution process will be included.
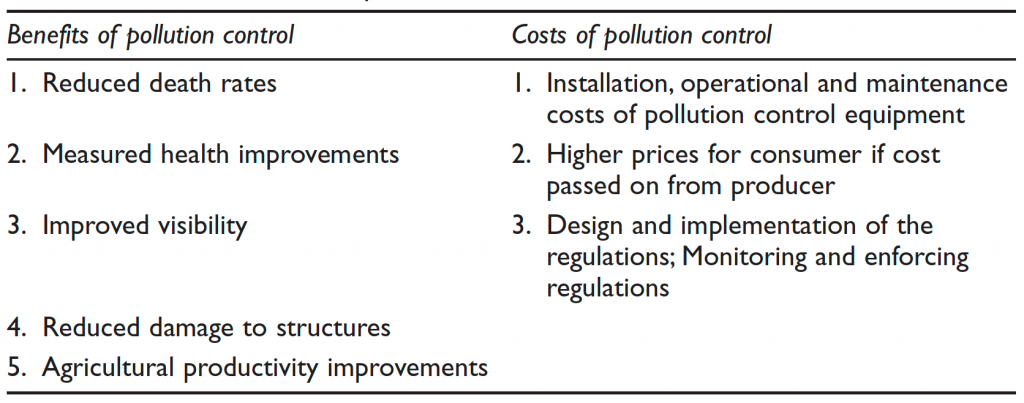
The first stage of a CBA is to qualitatively identify the costs and benefits of a project or initiative such as pollution control by a regulatory authority. As listed in Table 1, several benefits can be drawn for pollution control such as reduced death rates as less people are exposed to hazardous material. At a less severe level, the benefits of improved health can be seen at a personal level (such as a fall in counts of bronchitis, strokes, respiratory and heart disease), plus at a wider environmental scale an improved visibility (if in the case of light pollution or smog) can benefit activity that needs light input. Physical property benefits can be identified such as a reduced damage to structures due to the pollution control. A final benefit identified (note there are more than five) involves the reproductive fertility of soils and vegetation for agricultural produce to flourish and add more value if pollution is put under control.
Identified costs of pollution control will be the installation, operational and maintenance costs of pollution control equipment. For instance, an accurate water pollutant gauge that can track certain chemical release in the production of bio-chemicals will have to be manufactured, installed, monitored and repaired during the regulatory control period. A second cost of pollution control is the higher prices that may be passed on to the consumer rather than the producer in order to pay for the cost of control. This passing on of costs to the consumer will depend on the elasticity of supply and demand for the particular good or service. An environmental good with a short term inelastic demand such as gasoline, as there is no short term substitution effect to say electric fuel (unless a new car equivalently functioning electric car is able for purchase), the producer knows that it can increase its price in response to the tax as the consumer will still purchase the fuel. A third cost identified using the example of a pollution control initiative or project, is from a policy and policing perspective. If a regulation is introduced not only the cost of equipment is needed but the cost of administering, implementation, monitoring and enforcement will be need. For instance the collection of a tax will need to be audited by an authority to ensure the correct tax receipts are being collected.
Table 1: Benefits and Costs of Pollution Control
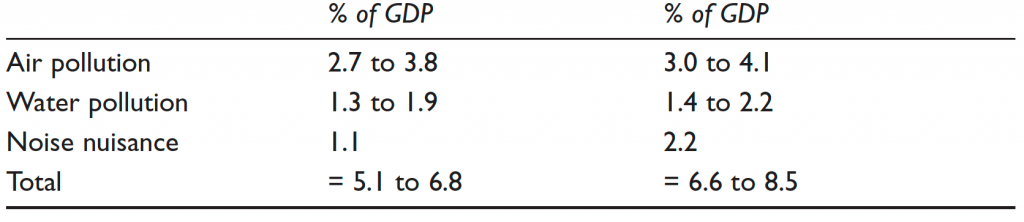
Once costs and benefits have been identified in a CBA, a measure of these particular indicators are needed in order to begin to attach a value to them. This is unless the measure in the first instance is a monetary value that makes measure to value conversion more straightforward. As per Table 2, measures of pollution damage are attributed as a percentage (%) change of Gross Domestic Product (GDP). In doing so, this measure allows a number to be attached to the damage of pollution, and thus provide measured benefits and costs of environmental policy introduced such as the introduction of pollution control. Note that these measures of environmental ‘damage’ meaning that they only provide indicators of costs and not benefits. Moreover, it should be noted that these measure are ‘ball-park’ roughly estimated numbers, meaning that accuracy of figures should be considered when making judgements based on the numbers. If looking in more detail at the costs in Table 2 it is seen that increases in pollution damage have been measured as specific percentage of GDP such as a 1.1% of GDP in noise pollution in Year 1, or a range of percentages of GDP such as air pollution ranging from 3.0% to 4.1% of GDP in Year 2. Comparisons of pollution damage as a % of GDP are also made in Table 2 that enables further analysis, such as the comparison of total measures such as the top end parameters of annual damage changing from 6.8% in Year 1 to 8.5% in Year 2.
Table 2: Pollution Damage by % Change (Year 1 to Year 2) as proportion of GDP
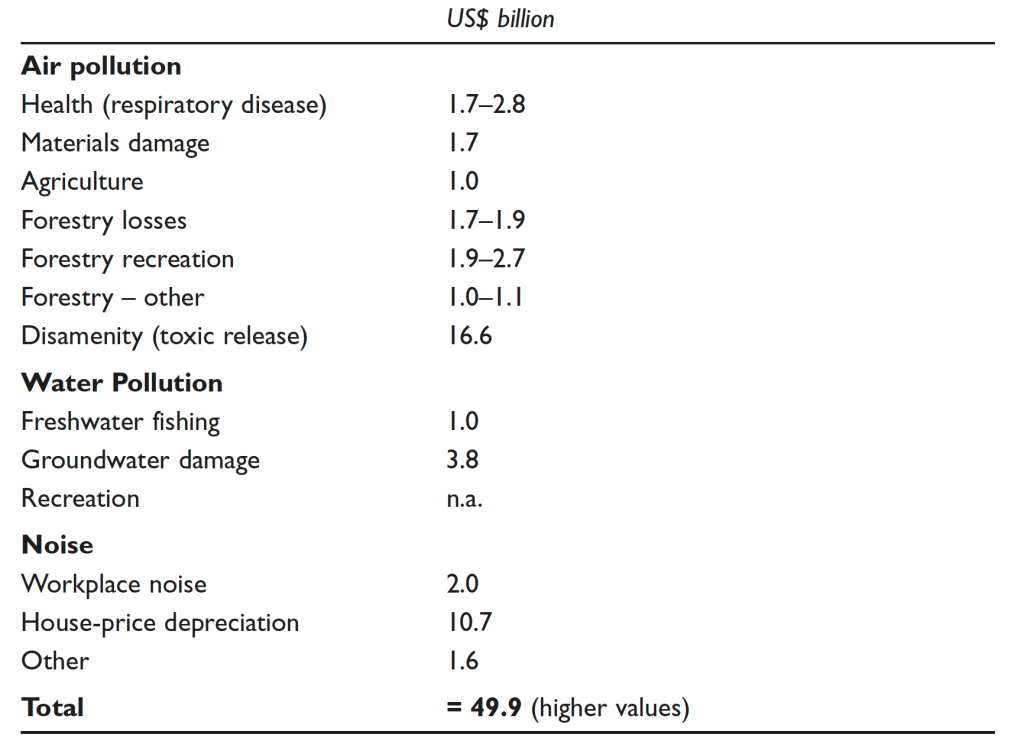
Do if specific metrics (such as % GDP) can be applied to environmental (or social) benefits and costs, attaching monetary value can be attempted. The example used in Table 3 below, demonstrates how particular pollution benefits and costs in have been identified and have monetary values attached to them. For instance, using ‘dummy’ values for a particular urban area indicators such a health have a monetary cost attached at between $1.7 Bn and $2.8 Bn due to pollution levels. Specific costs are those such as $10.7Bn attributed to house price depreciation due to pollution levels, such as those properties that are effected by smog in downtown traffic congested areas. Total costs in the example are valued at $49.9Bn and are an aggregate of all costs identified and valued. It should be noted that not all types of environmental damage are capable of ‘monetisation’ because a monetary value cannot be placed on all items. As only a limited set of items or indicators can be identified this means that the numbers produced are often undervalued estimates. Despite some difficulties in valuing fully and accurately, they do hold a great deal of practical use. The values are particularly used in policy (e.g. environmental policy), especially if a significant cost to the economy has been demonstrated (e.g. $49.9Bn in this example).
Table 3: Example of Pollution damage as monetary Costs
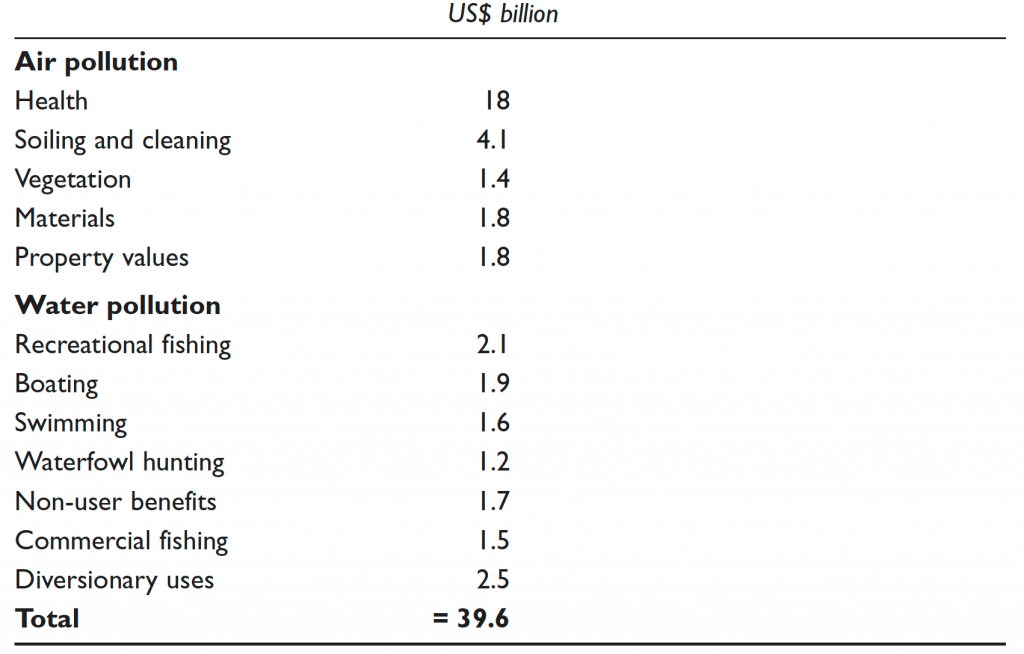
As well as costs from pollution being identified and value, as an inverse analysis the benefits of pollution control (rather than the costs of pollution) are equally possible and provided in practice. Table 4 demonstrates some of these benefits in monetary value such as within air pollution figures there are items such as improved health, for instance if less people are using hospital resources with bronchial and respiratory problems this will be a financial saving. Also within air pollution controls there would be benefits such as less degradation of assets therefore forgoing ‘soiling and cleaning costs’, vegetation being more productive if less polluted, as well as materials and property values increasing in value to less exposure to air pollution. Note that some costs of pollution (e.g. property damage incurred) may be netted off against the benefits of pollution control (e.g. property damage saved), although the net difference of what is actually polluted and what can be contained often differ meaning it is best practice to consider and identify both costs and benefits of items that generate monetary values if the project (e.g. a pollution control initiative) is introduced (in this instance the benefit) or if it was not introduced (in what would be the opportunity cost). Further benefits of pollution control in water resources used by urban areas are those such as increasing the leisure revenues from cleaner water (e.g. fishing, boating, swimming and hunting), plus those such as diversionary uses of water that could be the benefits of clean water irrigation. To add further analysis to benefit tables as demonstrated, the largest benefit gained from the pollution control is in the area of health with an estimated (and note more illustrative figure) $US 18Bn in Year X. By adding up the individual items to produce the total benefits of a pollution control measure it can be see (in Table 4) that without control pollution the damage caused would have been $39.6 billion higher than actually realised.
Table 4: Example of Benefits of Pollution Control
Summary
- CBA is seen as a useful way to apply monetary values when comparing like with like of both costs and benefits. CBA goes beyond the idea of an individual’s balancing of costs and benefits to society’s balancing of costs and benefits – in effect the measuring of external costs and benefits as well an organisations internal costs and benefits.
- If something meets a want, then it is a benefit. If it detracts from a want then it is a cost. More broadly to combine social and environmental costs, anything is of benefit if it increases human wellbeing, and anything is a cost if it reduces human wellbeing.
- CBA is not always the technique to assist in decisions on measuring and valuing environment and social benefits and costs (or in combination, well-being). A more considered judgement is necessary in deciding when to use CBA and when an alternative approach (e.g. market analysis) will be more effective and accurate.
- The first stage of a CBA is to qualitatively identify the costs and benefits of a project or initiative such as pollution control by a regulatory authority.
- Once costs and benefits have been identified in a CBA, measures of these particular indicators are needed in order to begin to attach a value to them. This is unless the measure in the first instance is a monetary value that makes measure to value conversion unnecessary.
- As an inverse analysis the benefits of pollution control (rather than the costs of pollution) are equally possible and provided in practice.
A full and formated version of this article can be cited as:
Squires, G. (2013). Chapter 8: Cost-Benefit Analysis and Discounting. In Squires, G. (2013) ‘Urban and Environmental Economics. Routledge.