Here we find some initial analysis that I’ve done looking retrospectively on the 2017 election in New Zealand. Its thrown up some interesting aspects that I didn’t know, and ones that most folk will find surprising.
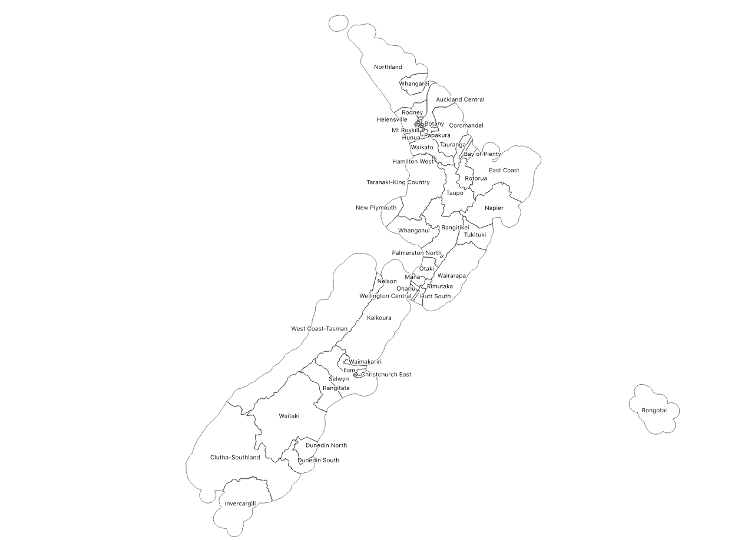
First up, is mapping the constituency boundaries. You will see the map is distorted because it includes a 12 mile offshore territorial limit.

So there are 120 seats up for grabs. 71 of these are winning votes either general (64 seats) constituency or by the Maori (7 seats) constituency
The constituency names of the 64 general electorate are often hard to visualise at national scale, as there are several constituencies in the denser urban areas.
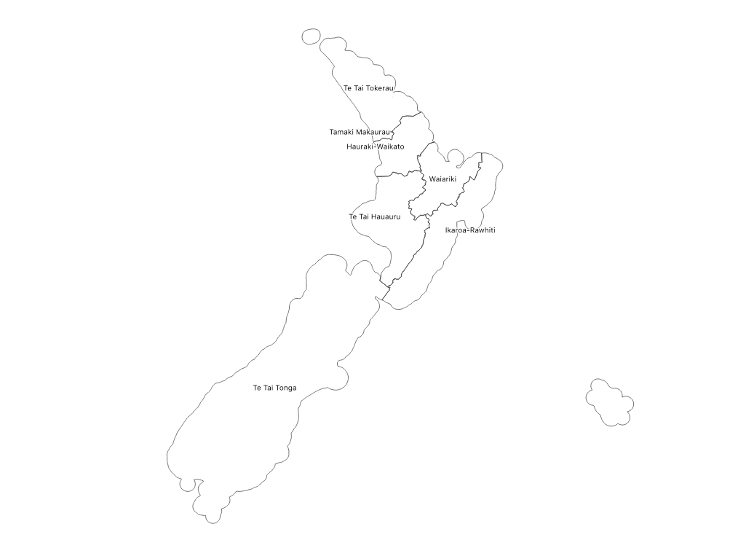
The 7 Maori electoral boundaries have less complications when considering scale
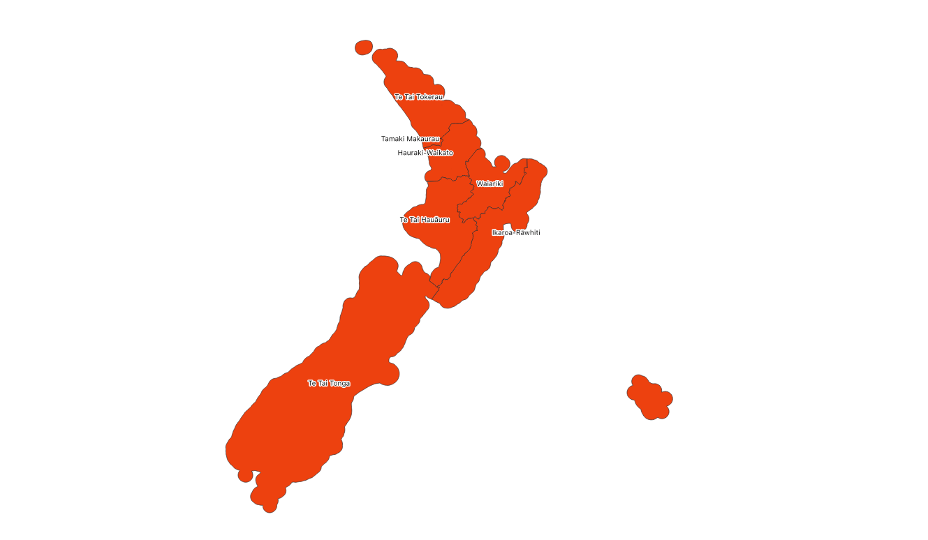
When we start looking at the Maori constituency winning party votes, we can see that Labour won all constituencies. No wins for The Maori Party interestingly enough.
For the general electorate 64 constituency seats we see Labour winning 22 seats, National winning 41 seats, and ACT winning 1 seat (Epsom, Auckland Region). No win for the coalition party New Zealand First or The Green Party.
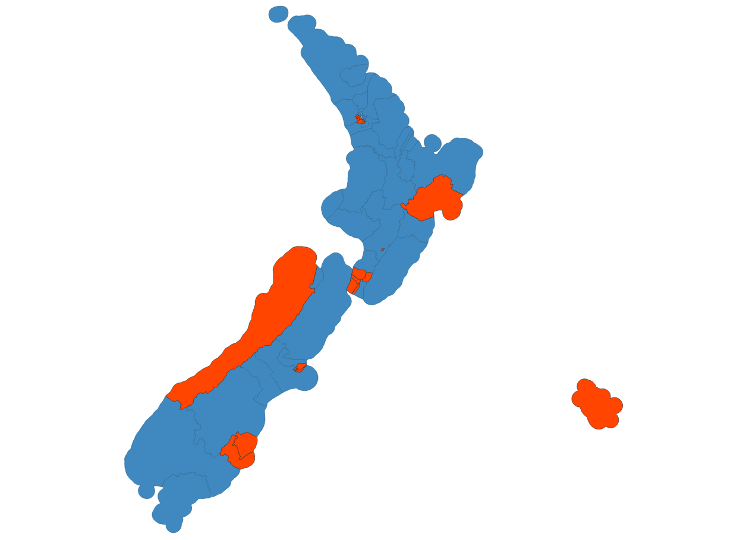
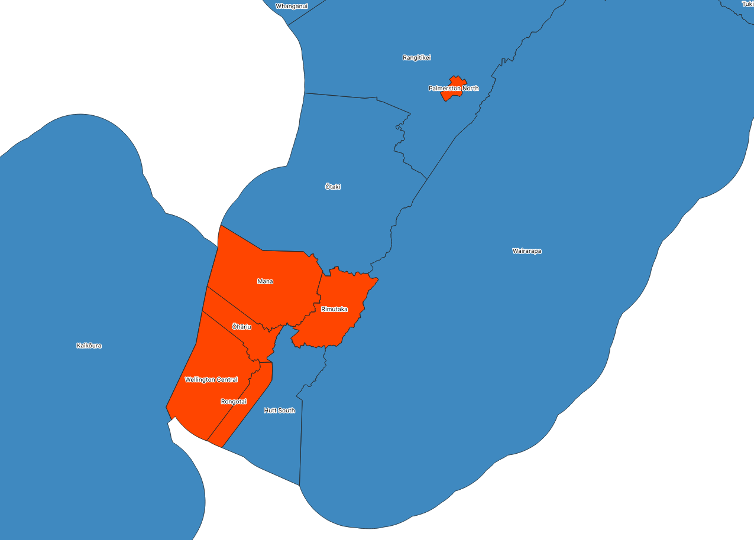
Looking at the map of national blue, we need to take a closer look more closely at land area to population density votes. Especially for calculating the remaining 49 proportional representation seats. We see high proportions of labour constituency wins in the urban areas of Auckland (South-West), Wellington, Palmerston North, Dunedin, Napier, and Christchurch. Here are more maps on the Auckland and Wellington winning party distributions for the general electorate
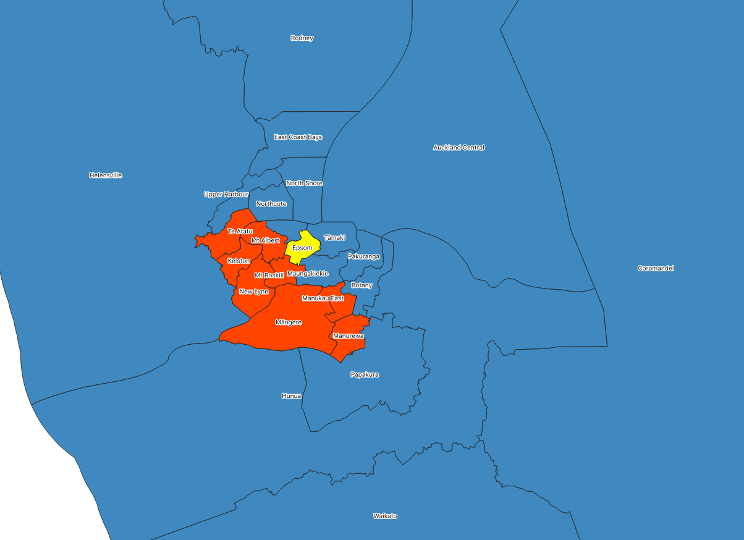
Have a look at the breakdown of winning parties. You will find the Prime Minister ARDERN, Jacinda Kate Laurell seat of Mt Albert (Auckland Region) taking over 60% of the constituency vote.
There are some more interesting stats we can map leading into the 2020 election held on Saturday 17th October 2020. The closed party list needs some attention.