Here’s an excerpt from on recent research project on Machine Learning for Real Estate and Housing Markets…
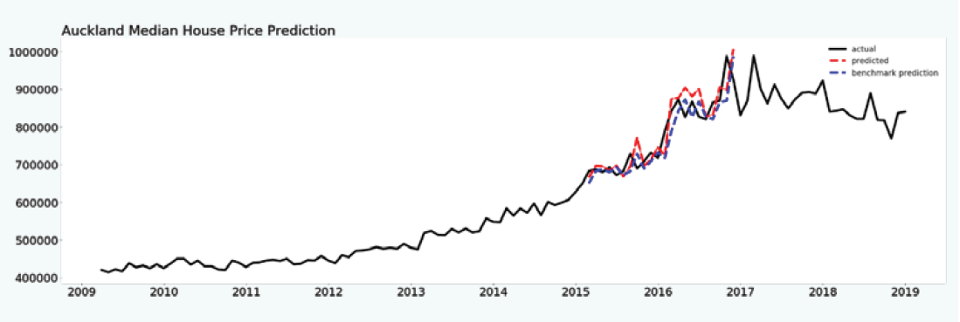
“…Here we consider all 21 national-level indicators and train models that attempt to predict Auckland’s median house prices. The figure shows the results of this experiment. The data from 2009 through to the end of 2015 was used for training, and then the expanding window strategy was used to test the predictions from 2016 through to 2017. The actual data is depicted in black, and this represents the true or actual values. The predictions made by the models are depicted as red dashed lines, while the predictions made by the benchmark models are shown as blue dashed lines.
The first feature to notice and to be aware of, as this will be relevant also to all the subsequent experiments, is that the characteristics of the data from 2009 through to the end of 2015 which was used for training are somewhat different to the characteristics of the testing data from 2016 through to 2017. There is more volatility in the data used for testing which suggests that some underlying factors are different between the training and the testing data. This makes the machine learning problem more difficult because machine learning is fundamentally based on the premise that the future will to some degree resemble the past. The data on this domain, for this particular time span, indicates that this is not necessarily the case. If the model testing were to be performed on the data spanning from 2013 to 2015, we could expect to achieve very different results. “